1.26.24 – The Mena Star
The recent economic shutdown resulted in record unemployment and left millions of Americans struggling financially. Even as the country reopened and people went back to work, some aspects of the economy have yet to return to normalcy. Housing costs are often the biggest line item for most people’s budgets, and the recent inflationary climate has made it difficult for many people to pay their mortgages.
Americans who own their homes outright are less vulnerable during recessions compared to those households with large mortgages. According to Census Bureau data, while nearly 63% of owner-occupied housing units are owned free and clear for homeowners age 65 and older, less than 28% of homeowners below retirement age have paid for their homes in full. This can leave the vast majority of the working population exposed to financial impact during periods of economic turmoil.
Percentage of Mortgages That Are Seriously Delinquent
Mortgage delinquency rates are trending up after declining to an all-time low during COVID
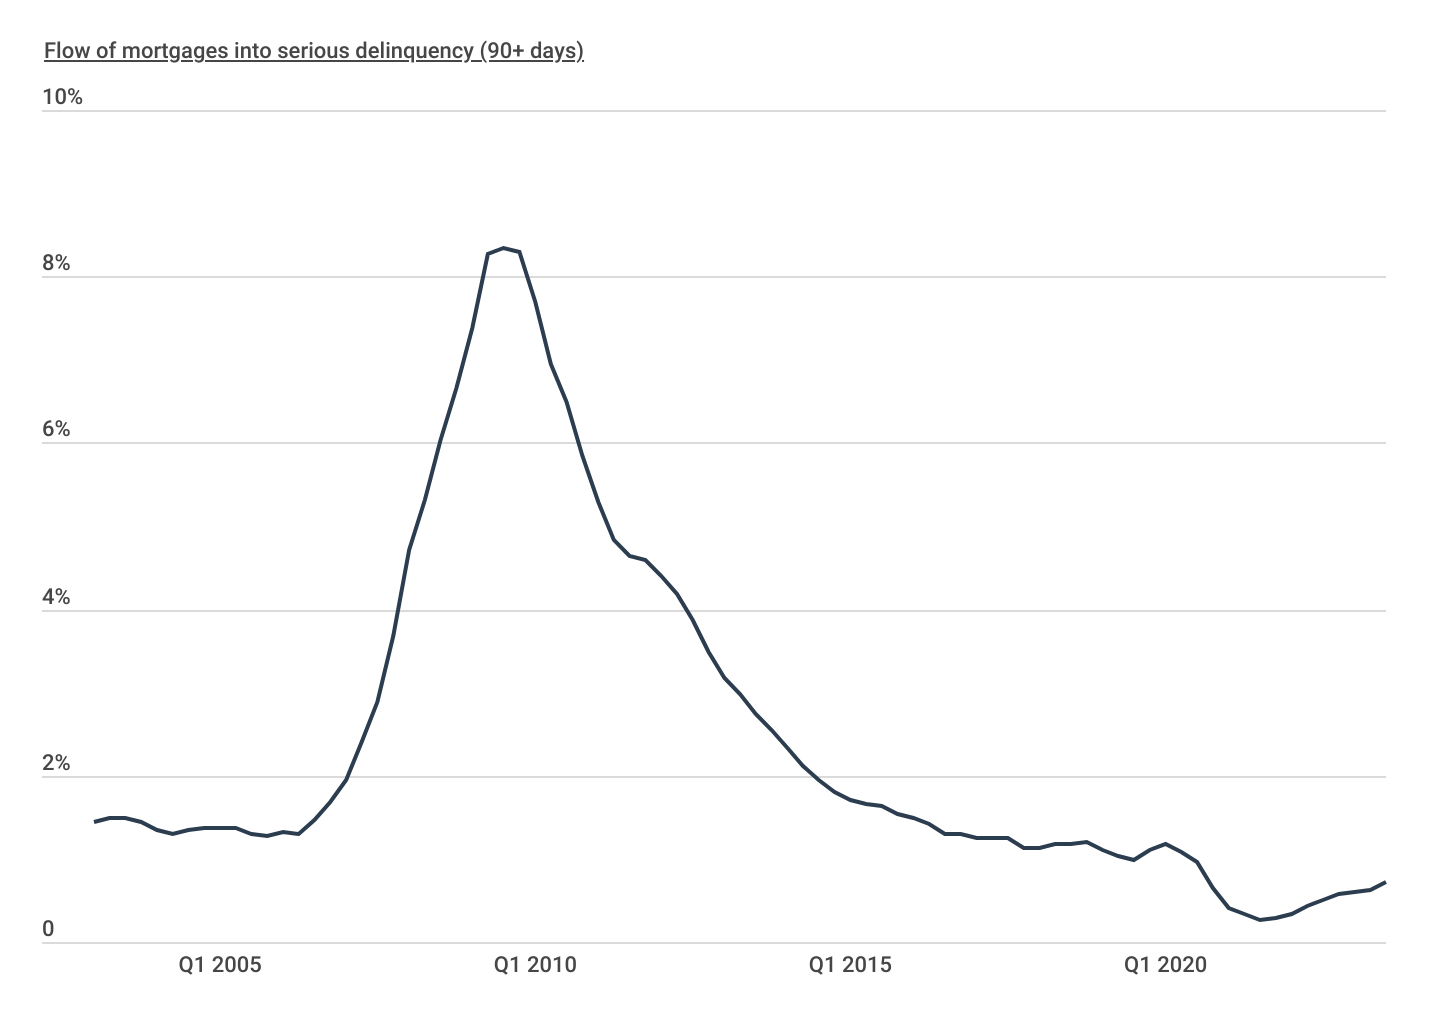
Source: Construction Coverage analysis of Federal Reserve Bank of New York’s Household Debt and Credit Report data | Image Credit: Construction Coverage
Mortgage delinquencies tend to rise significantly during periods of economic turmoil. According to quarterly data from the Federal Reserve Bank of New York, the delinquency rate on mortgages peaked at over 8% during the Great Recession and declined to below 1% in 2019. While the delinquency rate declined even further to 0.27% in 2021—primarily due to mortgage forbearance programs and economic stimulus efforts during the pandemic—the subsequent widespread inflation has started to take its toll. As of Q3 2023, the mortgage delinquency rate climbed to 0.72%.
Home Value and Housing Costs for Homeowners by Mortgage Status
Homeowners with mortgages have higher incomes but also significantly higher housing costs
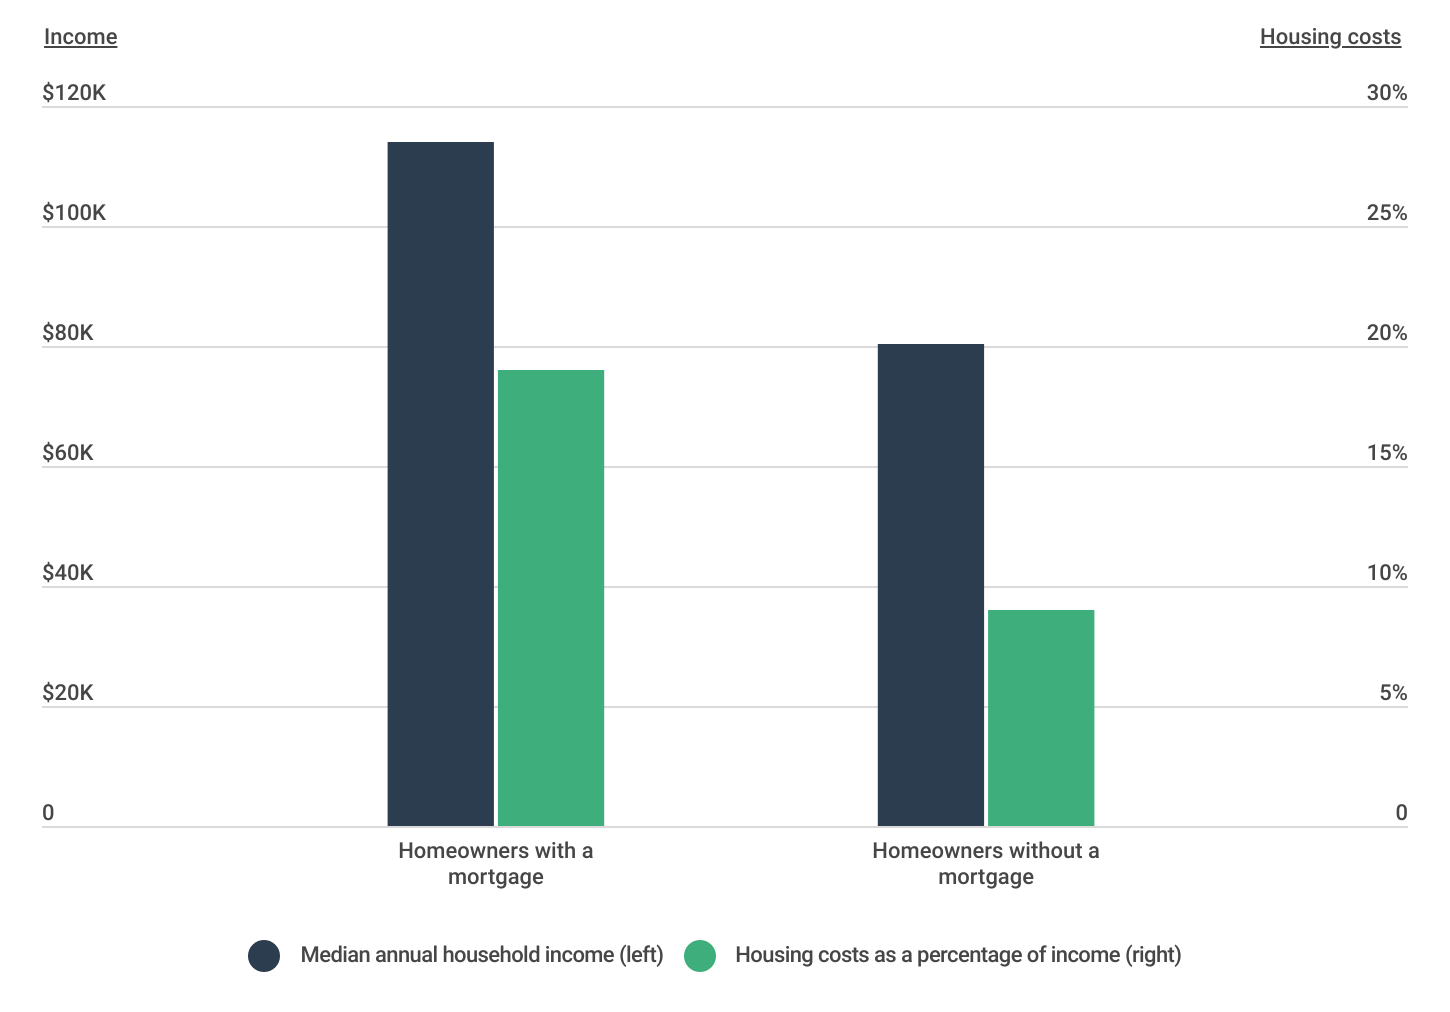
Source: Construction Coverage analysis of U.S. Census Bureau’s American Community Survey data | Image Credit: Construction Coverage
As expected, monthly housing costs between homeowners with and without mortgages differ considerably. The median housing costs—including mortgage payments, insurance, utilities, and other home-related expenses—for homeowners under age 65 with a mortgage totaled to 19% of household income. This figure was just 9% for homeowners under retirement age without a mortgage.
In addition to higher monthly housing costs, working-age homeowners with a mortgage tend to have higher household incomes. Among households with a mortgage, the median income is just under $114,000, compared to slightly over $80,000 for those households without a mortgage.
Owner-Occupied Homes That Are Owned Outright by Location
Southern states have the most residents who have paid off their homes
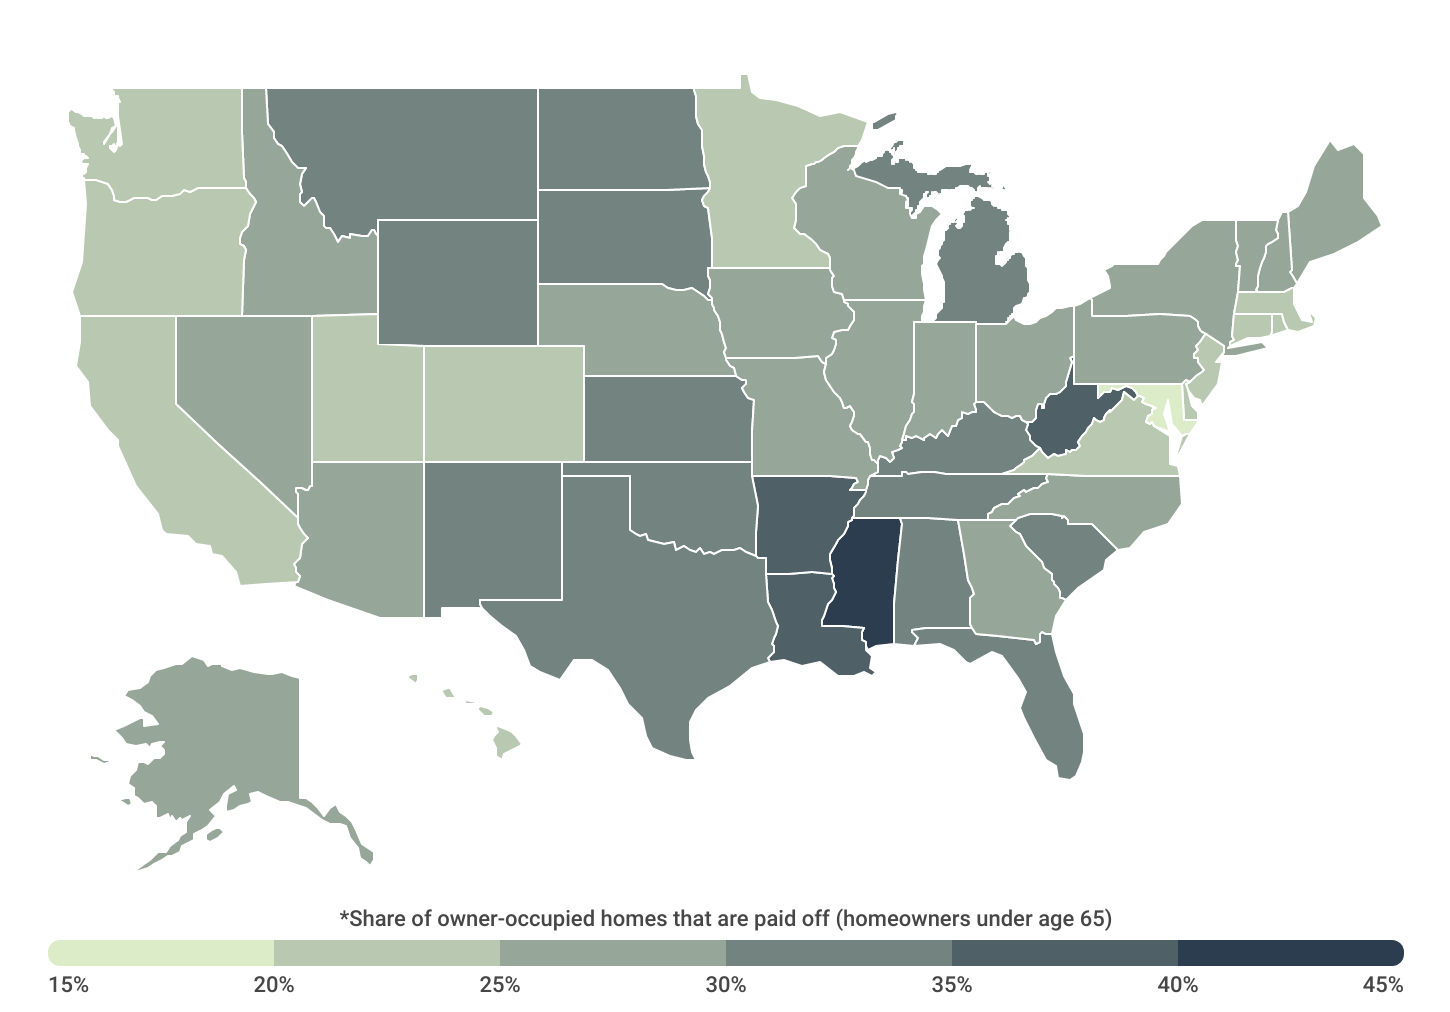
Source: Construction Coverage analysis of U.S. Census Bureau’s American Community Survey data | Image Credit: Construction Coverage
Mortgage payoff rates vary substantially across the country. While at the national level, the share of homeowners under age 65 who have paid off their homes is 27.7%, not all areas have equal rates of free-and-clear homeownership. Being mortgage-free is strongly (negatively) correlated with both household income and home value, so certain states in the South like Mississippi (40.2%), West Virginia (38.9%), Louisiana (35.8%), and Arkansas (35.4%) all have shares of owner-occupied homes that are paid off above 35%.
At the other end of the spectrum, Maryland has the lowest rate of owner-occupied homes that are paid off at 18.3%. Similarly, states along the Pacific Coast—where home values skyrocketed during the pandemic—have some of the lowest rates of free-and-clear homeownership among the working-age population. California (22.7%), Washington (22.8%), and Oregon (22.9%) sit at 45th, 44th, and 43rd out of all 50 states, respectively.
At the metropolitan level, nine out of the top 15 large metros for free-and-clear homeownership are found in the South—led by Houston, TX at 32.5%. Conversely, locations that saw their housing prices and cost of living jump during COVID—such as Washington, DC (16.1%) and Denver, CO (17.3%)—have the lowest share of owner-occupied homes that are paid off.
This analysis was conducted by researchers at Construction Coverage, a website that compares construction software and insurance, using data from the U.S. Census Bureau. Researchers ranked locations by the share of owner-occupied households without a mortgage (owned “free and clear”). For relevance, only owner-occupied households with positive income and a working-age primary householder (under the age of 65) were considered.
Here is a summary of the data for Arkansas:
- Share of owner-occupied homes that are paid off: 35.4%
- Median home value (w/o mortgage): $125,000
- Median home value (w/ mortgage): $200,000
- Median annual household income (w/o mortgage): $59,700
- Median annual household income (w/ mortgage): $91,000
- Median monthly housing costs (w/o mortgage): $415
- Median monthly housing costs (w/ mortgage): $1,233
- Housing costs as a percentage of income (w/o mortgage): 8%
- Housing costs as a percentage of income (w/ mortgage): 17%
For reference, here are the statistics for the entire United States:
- Share of owner-occupied homes that are paid off: 27.7%
- Median home value (w/o mortgage): $250,000
- Median home value (w/ mortgage): $350,000
- Median annual household income (w/o mortgage): $80,200
- Median annual household income (w/ mortgage): $113,900
- Median monthly housing costs (w/o mortgage): $603
- Median monthly housing costs (w/ mortgage): $1,842
- Housing costs as a percentage of income (w/o mortgage): 9%
- Housing costs as a percentage of income (w/ mortgage): 19%